Peeking problem in A/B testing: Frequentist approach
Peeking problem in A/B testing: Frequentist approach
By Abdelhak Chahid
8 min read
In our current state of digitization, data-based decision-making has become an integral aspect of online businesses. Evidence-based practice, the paradigm used to make those informed decisions, relies on the use of data and solid statistical methods to solve real problems.

- Authors

- Name
- Abdelhak Chahid
A/B testing is one of the most commonly used statistical methods and the most of successful applications of statistical inferences in the internet age, particularly in online settings for data-based decisions.
What Is A/B Testing?
A/B testing, also known as split testing or hypothesis testing, is a statistical technique to compare two or more groups to determine whether the difference in a metric between the groups can be attributed to variable changes rather than pure chance. In A/B testing, A refers to the original testing variable. i.e. original webpage (Null hypothesis). Whereas B refers to ‘variation’ or a new version of the original testing variable (Alternative hypothesis).
Most of the A/B tests are conducted using the frequentist statistical test namely the t-test or z-test. Frequentist school is the most used approach when it comes to statistical inference, this is commonly taught at the high school and university levels.
The experimenters using this approach are interested in the p-value1 resulting from the statistical test to reject the null hypothesis H0 when the p-value is less than a prescribed significance level2 α (often 0.05).
Let us clarify this further through an example: Assume a marketeer may want to determine the effect of an ad color on the Click-through rate CTR3. One can hypothesize that a green background of an ad will increase the CTR. To provide data-based evidence for such a claim, by following the frequentist approach, a web developer might be consulted to create two web pages, which should be the same except for the change. Then these web versions will be shown simultaneously and randomly to two different segments of visitors to determine which version does increase CTR. This experiment will be kept running for a while until the prespecified sample size is achieved, Subsequently, a statistical test can be computed to compare CTR between two groups of visitors. If the test is statistically significant, one will have enough evidence to accept the new web version and remove the original. Otherwise, one may conclude that there was not enough evidence for the new version. By statistical significance we mean the p-value is smaller than a prespecified threshold, usually 0.05. When this is the case we reject the Null hypothesis (original web version) and accept the Alternative hypothesis (new web version). At this stage, we can say with a high degree of certainty that the observed difference between the web versions is statistically significant and is not attributed to chance.
Introducing the peeking problem
The rapid rise of online service platforms nowadays that provide A/B testing implementation, has led to an increase in continuous monitoring of the test results. In this setting. Marketers without statistical knowledge might be attempted to run the experiment and control the statistical results directly live while the experiment is running. A misleading error is emerging when continuously monitoring the A/B test, namely the p-value peeking.
What is p-value peeking?
While the experiment is running, many mistakes can be made. One of these mistakes is tricky and called “p-value peeking”. This mistake is a consequence of continuous monitoring of the A/B test results and taking action before the A/B test is over. Even those who were taught how to perform A/B tests and report the statistical results are still making this misleading mistake. As a consequence of this type of behavior, users have been drawing inferences that are not supported by their data across many industries.
Example of peeking problem
In an article published by Johari et. al, it has been shown that continuous monitoring in conjunction with early stopping can lead to highly inflated type I error4 rates. By type I error or the false positive we mean the number of false results that were deemed as significant whereas, in reality, these are not. In simple English: an innocent person is convicted.
From a practical point of view early stopping of a running experiment is more beneficial in terms of costs, so there is value to detecting true effects as quickly as possible or giving up if it appears that no effect will be detected soon so that they may test something else.
Unfortunately, when this type of behavior is shown within a frequentist approach without following the steps we discussed early, then the entire statistical results reliability is undermined.
Simulation
Enough theory, for now, Let us illustrate what we have described with a simulation case in Python. We will describe two scenarios. Here we want to show the effect of continuous monitoring on picking the wrong web version that was declared to be of statistical significance, whereas, in reality, this is not true.
Scenario I: valid A/B test
Suppose we learned from an early experiment that CTR was 0.25, or we expect to achieve such a CTR. Further, we may want a minimum detectable effect (MDE)5 to be 0.1, with a power6 of 0.80 and a significance level of 0.05. One important question will emerge here: how many users do we need to incorporate into each group to detect such a difference?
To calculate the number of visitors that are needed to detect such a difference we can use the Power calculation built-in function in Python.
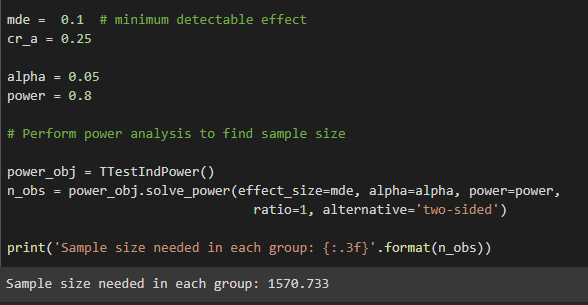
According to the input we provide, we will need at least N=1571 observations in each stream (rounded up).
Let us generate two streams of Bernoulli data: two streams of ones and zeros describing whether we observed a click or an abandonment in each stream. What we want to answer is: is there a statistically significant difference between the measured average number of CTRs of the two streams?
Once we get at least 1571 observations in each stream (figure 2), we can run a statistical test, and determine the p-value to evaluate if there is evidence for version A or B version.
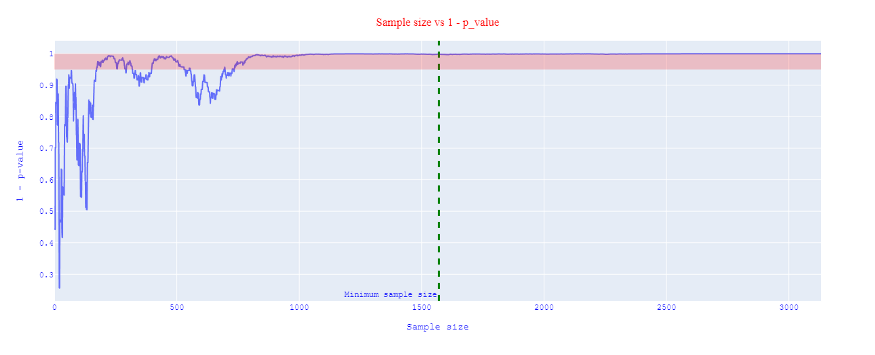
After the experiment has included the minimum required sample size, we can safely now evaluate the results and extract a valid statistical conclusion.
Scenario II: continuous monitoring
Suppose, we simulate the same study, but now we let the effect be 0, i.e. there is no difference between version A and B. In addition, we want to see what will happen if we continuously look at the results and stop this experiment as early as the p-value is deemed to be significant. What is wrong with this behavior?
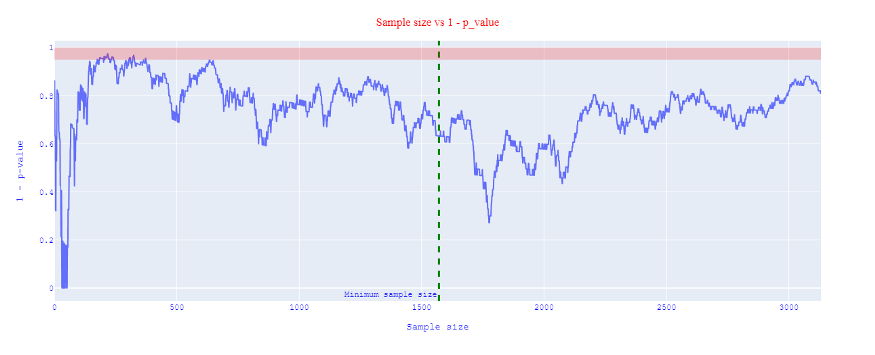
In figure 3, we see that the p-values oscillate near the alpha level at the start, and in some cases, it does cross that red region (significance region). As the sample size increase, we see a runaway of this level. Because the p-value had already crossed the significance level several times. Anyone who is continuously monitoring this experiment might have incorrectly called it a winner early on, hence stopping the experiment.
How to avoid peeking problem
If you run A/B test experiments within a frequentist paradigm: the best way to avoid peeking at the p-value is to follow A/B testing steps: one must decide in advance how many observations one needs for the test, run the experiment and wait until the experiment achieved the minimum required users, compute the statistical test, evaluate the results and make a decision. Of note, Peeking at the p-value is not wrong as long as you can restrain yourself from stopping the experiment before it terminates.
Conclusion
Online A/B testing analytical platforms are powerful and convenient, However, these tools should be used with a lot of caution. Any time they are used with a manual or automatic stopping rule, the resulting significance tests are simply invalid as long as the experiment did not reach the required sample size.
In this article, we discussed why continuous monitoring violates the existing paradigm within the frequentist approach and leads to invalid inference. Furthermore, we have demonstrated empirically the pitfalls of continuous monitoring.
The online platform on the internet has changed the paradigm of A/B testing and has led to the following challenge: is it possible to develop a method and deploy it into a platform where the user will be continuously monitoring experiments whereas the false positive and experiment runtime will still be kept under control?
In the next articles, we will touch upon some suggested methods that allow users to control the false positive rate and improve the user’s ability to tradeoff between detection of real effects and the length of the experiment, while continuously monitoring the experiment.
GitHub repository for the Python code: https://github.com/achahid/A_B_testingPeekingProblem
Footnotes
P-value is the probability of the observed test results being random and not due to actual evidence. Therefore, the smallest the p-value is the lower the probability that the finding is random. ↩
Significance level also known as alpha is the probability of rejecting the null hypothesis when it is true. For example, a significance level of 0.05 indicates a 5% risk of concluding that a difference exists when there is no actual difference. ↩
Clickthrough rate CTR is the number of clicks that your ad receives divided by the number of times your ad is shown: clicks ÷ impressions = CTR. For example, if you had 5 clicks and 100 impressions, then your CTR would be 5%. ↩
Type I Error or False Positive occurs when a researcher incorrectly rejects a true null hypothesis. Hence the reported findings are significant when in fact they have occurred by chance. ↩
Minimum Detectable Effect (MDE) is the effect size that if truly exists can be detected with a given probability with a statistical test ↩
The statistical power is the probability of a statistical test detecting an effect if there is a true effect present. With a power of 80%, we are 20% of the time missing to detect the true effect. ↩