Performance testing real-time data in JavaScript
Performance testing real-time data in JavaScript
By Daan van Berkel and Bader Ali
5 min read
To be able to chose the right protocol for handling real-time data, this post shares with you how we, based on speed, CPU- and memory usage, setup and performed performance tests on different real-time data protocols.

- Authors

- Name
- Daan van Berkel

- Name
- Bader Ali
This developer blog is a result of Bader and Daan's graduation research.
The protocols and frameworks compared in this blog are Long-polling, Mercure, Ratchet, SocketIO, server-sent Events (with NodeJS and ReactPHP) and Websockets.
Setting up a testing environment
The different nature of each protocol made it inherently difficult to write a generic performance testing interface. Why a generic interface? Because it opened the possibility to treat each protocol the same. It made it possible to write a single test executioner and have it inject a different protocol under the hood. This executioner, also called test-runner, is the core piece of code that can run the performance test and export the result to a JSON file.
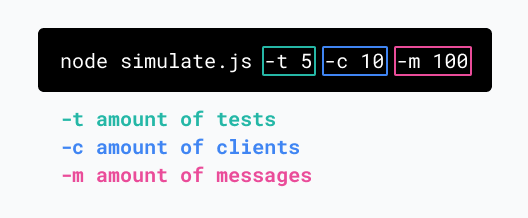
To run the tests we used different tools: Docker(-compose), Puppeteer and NodeJS. This whole process is started by a simulate.js script. This script can be run with the following command and arguments to configure the performance test.
Why
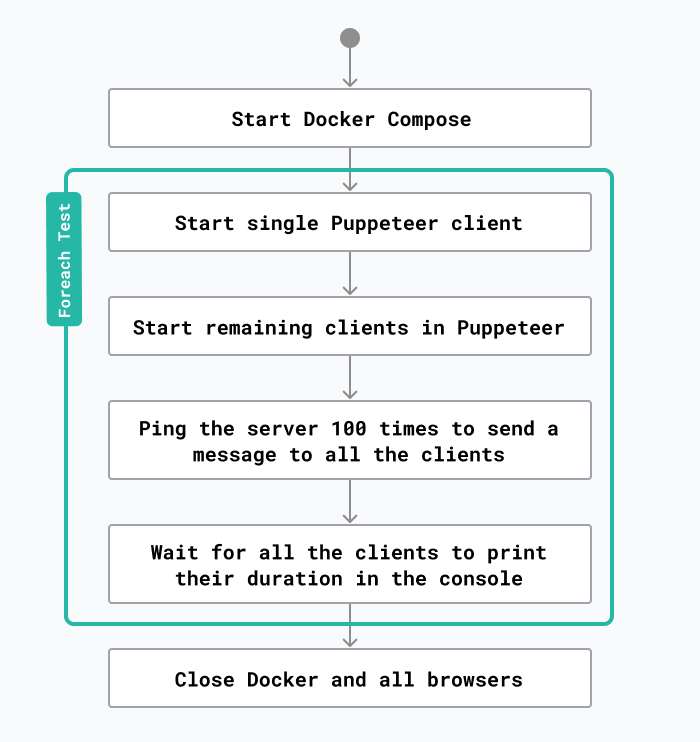
While looking at the diagram above you may ask yourself a few questions. Let’s walk through those together.
Q 1. Why is Docker used in the performance tests?
Some of the protocols require a server that the browser can connect to. Docker allows us to write a docker-compose file for each protocol and have the test-runner start the Docker containers. Docker containers allow us to monitor the CPU and memory usage using the Docker Stats API.
const dockerUp = (readyText) =>
  new Promise(async (res) => {
    const docker = spawn('docker-compose', ['up'])
    docker.stdout.on('data', function (data) {
      if (data.toString().includes(readyText)) {
        res()
      }
    })
  })

// example usage
await dockerUp('PHP server started on')
Example 1: Start docker-compose from NodeJS.
const http = require('http')

function dockerWatchStats(containerName, callback) {
  http
    .request(
      {
        socketPath: '/var/run/docker.sock',
        path: `http://localhost/v1.41/containers/${containerName}/stats`,
      },
      (res) => {
        res.setEncoding('utf8')
        res.on('data', (data) => {
          data = JSON.parse(data)
          // See https://docs.docker.com/engine/api/v1.41/#operation/ContainerStats for formula
          let cpuPercentage = calculateCpuPercentage(data)
          let memUsage = calculateMemory(data)

          callback({ cpuPercentage, memUsage })
        })
      }
    )
    .end()
}

// Example
dockerWatchStats('', (usage) => {
  console.log(usage)
})
Example 2: Get CPU- and memory usage from Docker.
Q 2. Why is a single instance of a Puppeteer browser started first?
Unfortunately, Puppeteer does not provide an API for monitoring the CPU and memory usage for each separate tab. However, these values can be extracted by the system itself using the built-in monitoring tools. The built-in monitoring only allows for measuring an entire process not a single tab in a web browser. For that reason, we need to spin up a separate Puppeteer browser with a single client to measure its performance. Below is a code example of how to do this in NodeJS, using the pidusage package:
const pidusage = require('pidusage')

function browserWatchStats(pid, callback) {
  setInterval(() => {
    pidusage(pid, function (err, stats) {
      if (stats == null) return
      callback({
        cpuPercentage: stats.cpu,
        memoryUsageInByte: stats.memory,
      })
    })
  }, 500)
}

browserWatchStats('', (usage) => {
  console.log(usage)
})
Example 3: Get CPU- and memory usage from Puppeteer.
Q 3. How to communicate between Node.JS and all Puppeteer instances?
After the browser is done receiving all messages from the server, it needs to communicate this information back to the NodeJS application. This can be done using a hook in the Puppeteer page on the console event. It is possible to listen to `console.log` events from a page and get the results in a callback in NodeJS. A code example:
page.on('console', (msg) => console.log(msg._text))
Example 4: Pass console message through to NodeJS.
Q 4. Why not send the messages directly from the test-runner?
To keep the test fair we need to make sure that the usage in the test does not differ from how the protocol is used in a production environment. We also need to make sure that the connections between each test are the same. Let's take ReactPHP as an example. The test-runner is written in JavaScript so it has no direct way of communicating with PHP:
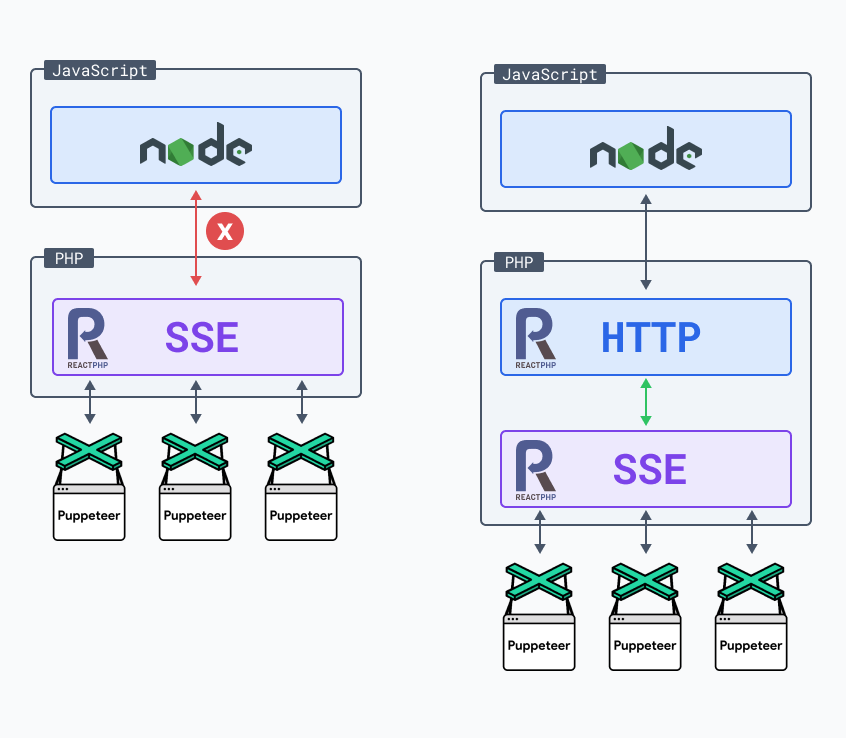
The left option is not possible because of language collision. We can combat this issue by writing an HTTP endpoint in ReactPHP that communicates to the SSE code to send a message to the Puppeteer clients. However, we do not face this problem when using a JavaScript protocol/library. Let's take SocketIO as an example:
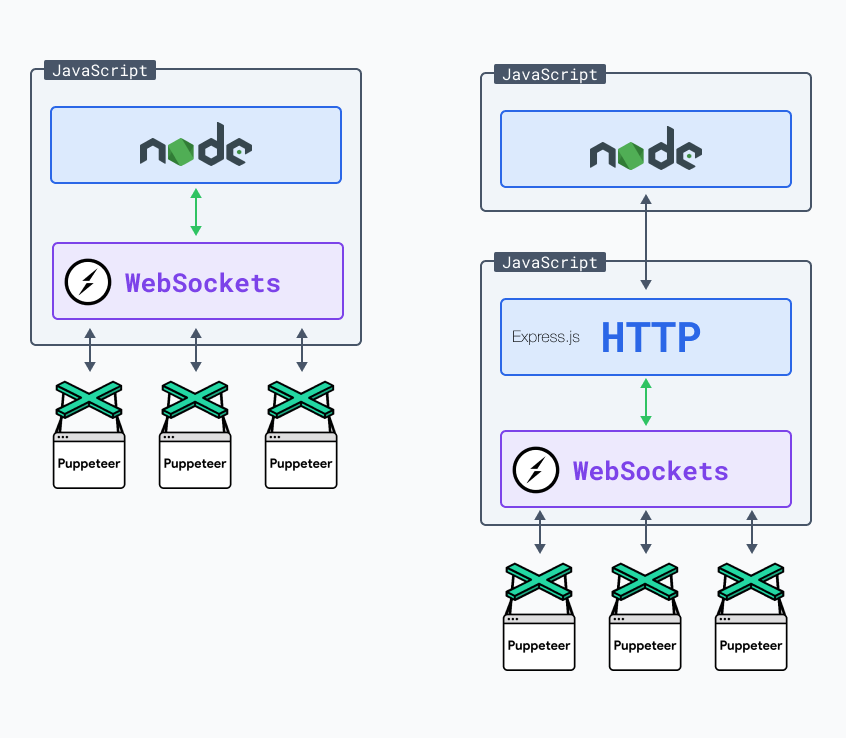
Since SocketIO is also written in JavaScript we could import it in the test-runner and make use of it directly. This however would not be a fair comparison. To make it fair we have added an ExpressJs endpoint that the test-runner can ping to.
Caveat: browser connection limit
Each protocol has its pros and cons. While executing the performance tests we noticed that some of them were maxing out on connections. For example, Server-Sent Event on HTTP/1.1 can only handle 6 connections per browser. This can be combated by starting a new browser per 6 tabs for Server-Sent Event.
Results
As we mentioned earlier, the test runner can export the results to a JSON file. But what fun would it be if we stopped there? To get a real feel and understanding of the results we need to visualize the data. For this, we chose to create a web application using NodeJS, ChartJS, AlphineJS and TailwindCSS. In the image below you find the results for 100 clients each receiving 1000 messages. The results are the average of 10 tests. The Y axis represents the time in milliseconds it took between receiving the first and last message.
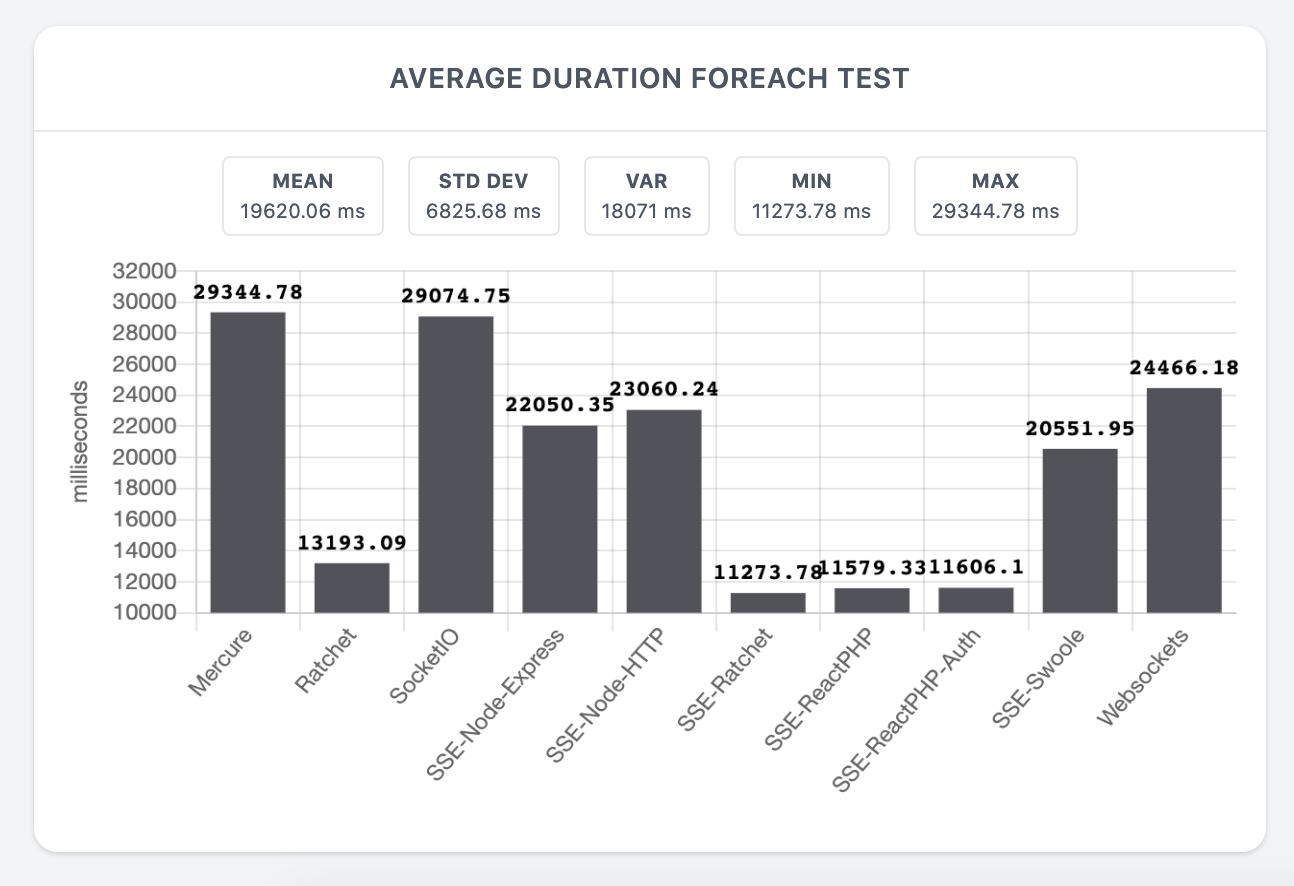
You can discover all results at https://iodigital-com.github.io/techhub-performance-testing-real-time-data-examples.
We hope that this blog post helps you with removing some roadblocks with performance testing.